Smarter maps – smarter decisions
A is a simple yet powerful app that makes advanced location optimization accessible – without requiring GIS expertise or expensive software.
Designed for public health decision-making, it enables efficient facility planning with minimal effort.
The app eliminates technical complexity, allowing users to upload data, visualize locations on a map, and generate optimized placements in just a few steps.
A clean interface and intuitive workflows ensure that anyone, regardless of technical background, can make data-driven decisions effortlessly.
The p-Median Solver delivers high-level optimization capabilities – comparable to specialized GIS tools.
Built on powerful heuristic algorithms, it offers a sophisticated yet budget- friendly solution for organizations that require precision without high software expenses.
Purpose-built for optimizing service locations in public health.
Whether planning health facilities, diagnostic laboratories or treatment sites, it guides users through a streamlined optimization process, ensuring efficient resource allocation and improved service accessibility.
The app solves the p-Median Problem, an optimization challenge that identifies the best locations for a set number (p) of new facilities by minimizing the total demand-weighted distance between demand points and the nearest facility (e.g., labs, warehouses).
→ Optimization target: minimizing the total demand-weighted distance
→ Distance: straight-line distances
→ Linkages: All origin facilities are part of the solution, assigned to the geographically closest destination
→ Algorithm: heuristic algorithm (Greedy, Teitz and Bart)
Upload your data through a user-friendly interface. The app automatically checks data quality and alerts missing data.
You can chose the number of new service points for your network and the app models the optimal locations.
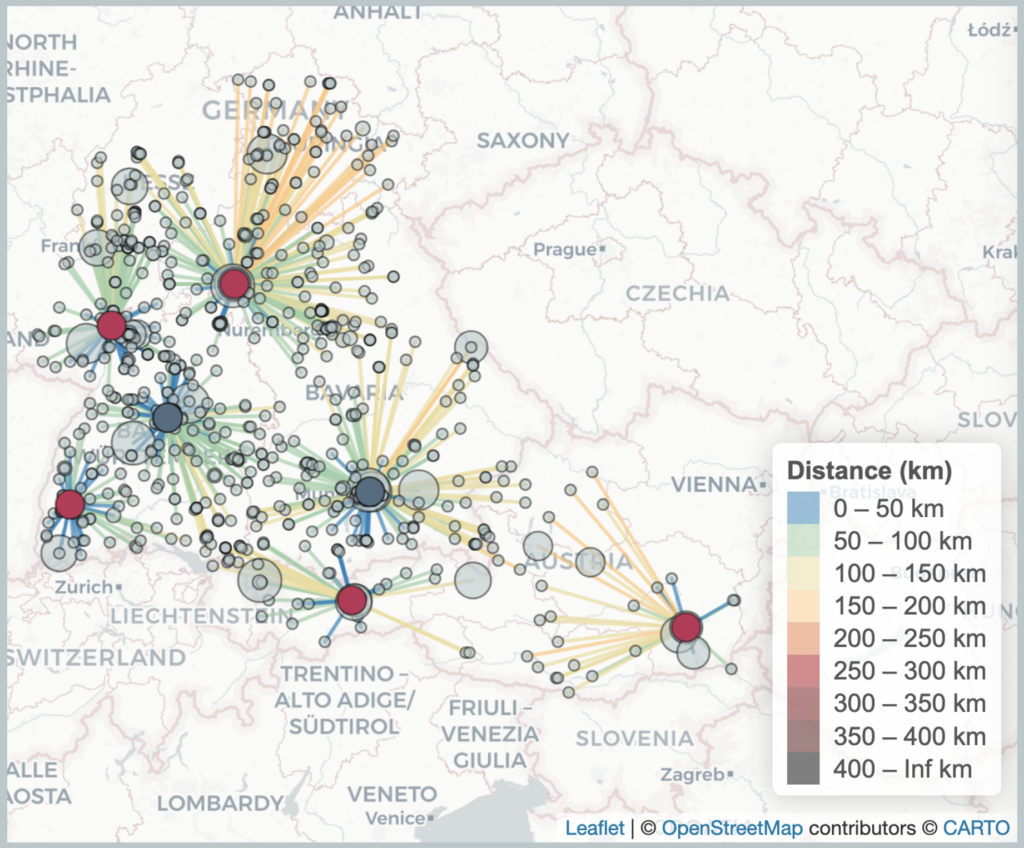
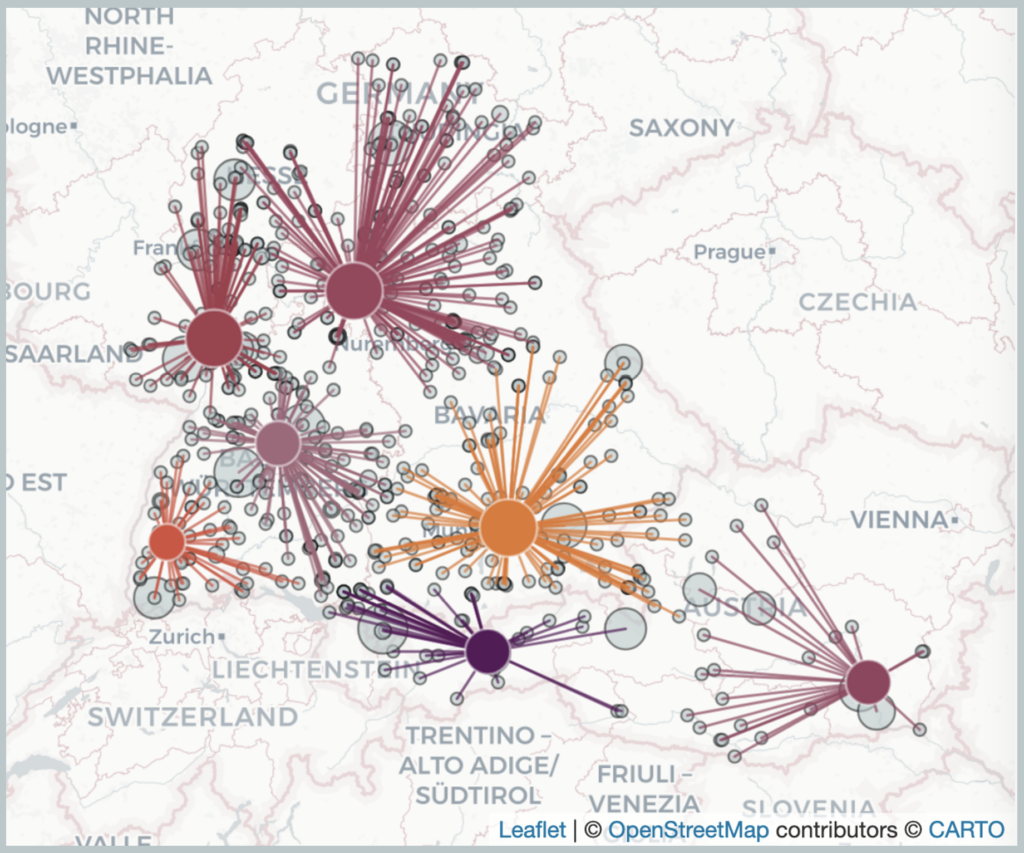
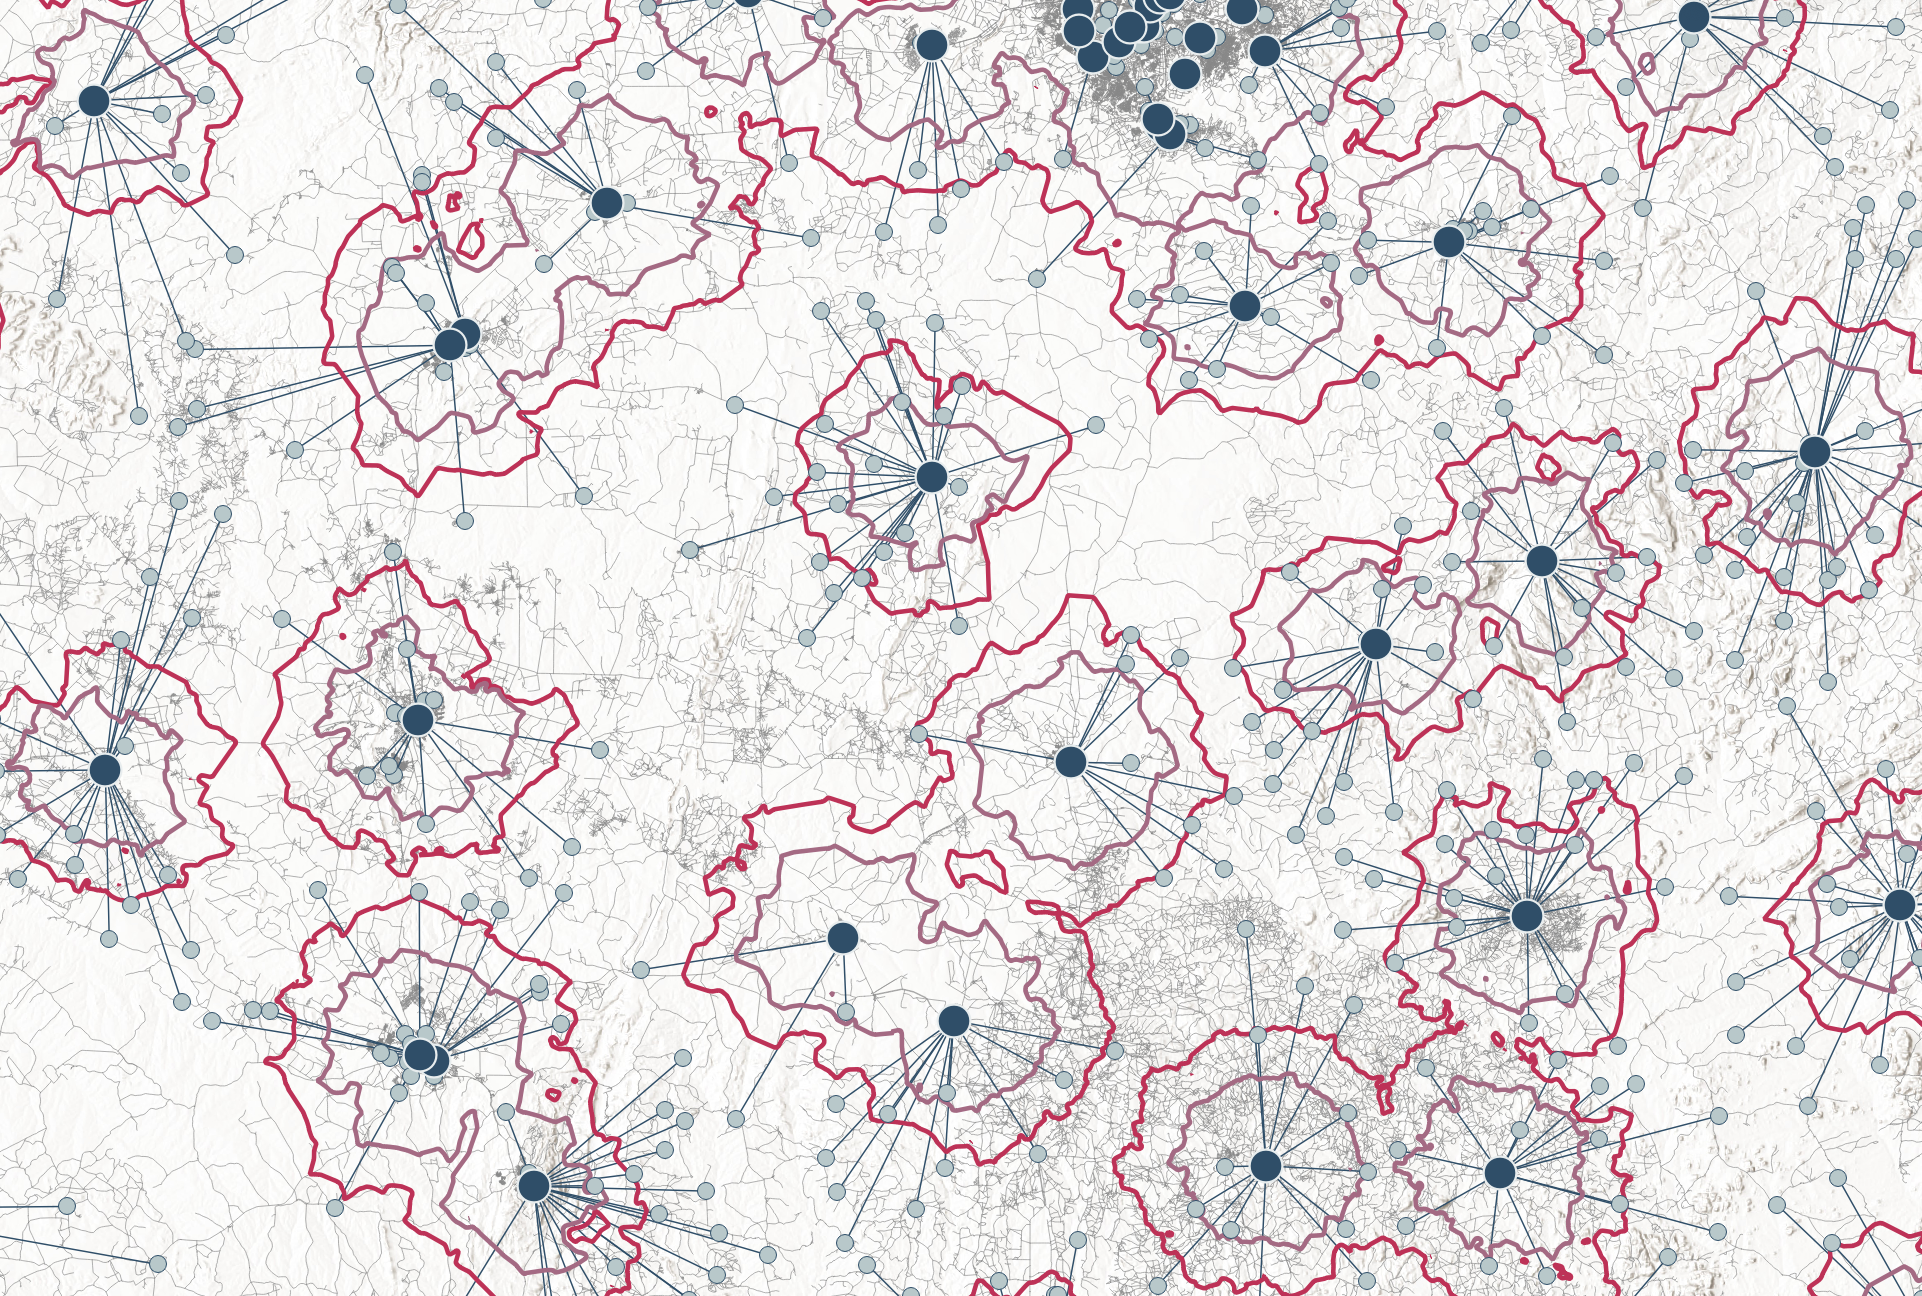
The app will calculate two maps – one showing your existing network (baseline) and another displaying the optimized network with newly modeled sites. Both maps will illustrate demand points linked to the closest sites, with distances color-coded to help you visualize the travel distances.
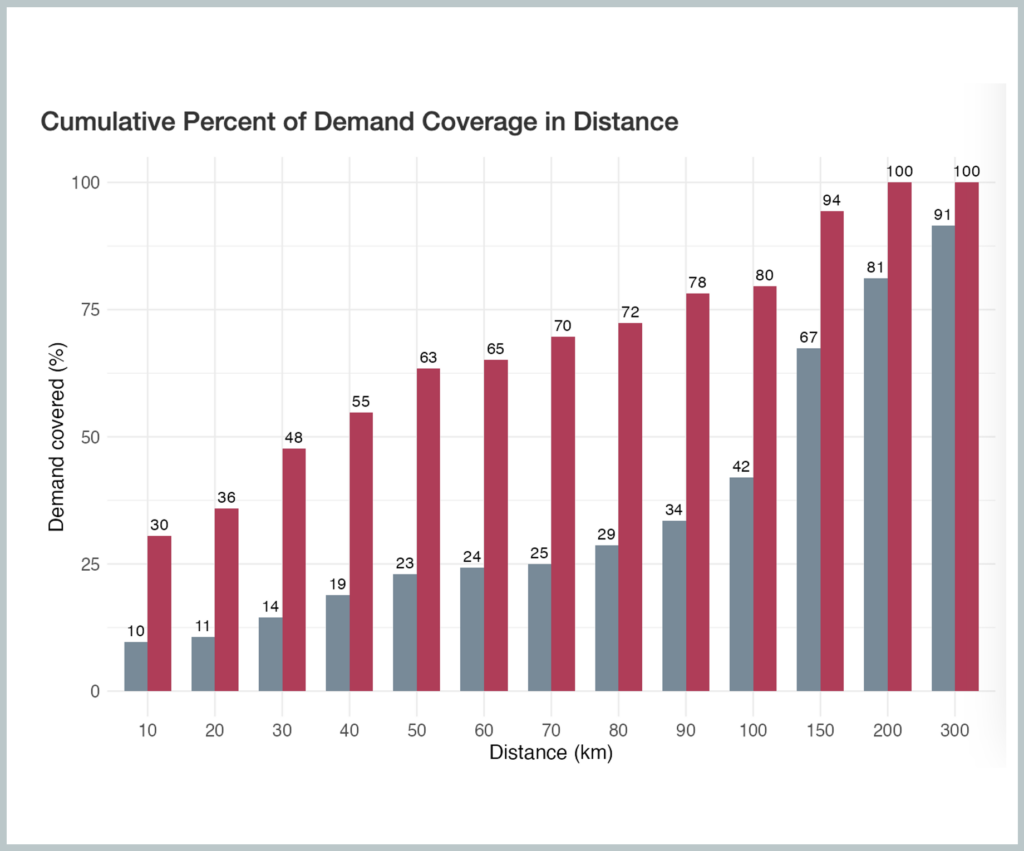
The app will provide you with key metrics comparing the baseline and optimized networks.
You’ll be able to see the percentage of demand covered within various distance thresholds, as well as demand-weighted average travel distances.
Performance metrics of the existing- and optimized network are compared side-by-side.This allows you to assess improvements in both coverage and accessibility after optimization.
You will see the allocation of demand to both existing and optimized locations, helping you plan for the required resources at each site to meet demand effectively.
The app will allow you to export the analysis results, including maps and metrics, so you can use them in reports, presentations, or further analyses.
All results data are available for download in Excel for you to continue working with the results of your optimized network.
| Cookie | Duration | Description |
|---|---|---|
| cookielawinfo-checkbox-analytics | 11 months | This cookie is set by GDPR Cookie Consent plugin. The cookie is used to store the user consent for the cookies in the category "Analytics". |
| cookielawinfo-checkbox-functional | 11 months | The cookie is set by GDPR cookie consent to record the user consent for the cookies in the category "Functional". |
| cookielawinfo-checkbox-necessary | 11 months | This cookie is set by GDPR Cookie Consent plugin. The cookies is used to store the user consent for the cookies in the category "Necessary". |
| cookielawinfo-checkbox-others | 11 months | This cookie is set by GDPR Cookie Consent plugin. The cookie is used to store the user consent for the cookies in the category "Other. |
| cookielawinfo-checkbox-performance | 11 months | This cookie is set by GDPR Cookie Consent plugin. The cookie is used to store the user consent for the cookies in the category "Performance". |
| viewed_cookie_policy | 11 months | The cookie is set by the GDPR Cookie Consent plugin and is used to store whether or not user has consented to the use of cookies. It does not store any personal data. |