How far is TB testing?
A high-level, multi-country analysis of what it might take to bring TB diagnosis within walk-in distance
With several new TB diagnostics in the pipeline [1,2], expectations are rising that some of those tools will not only be more affordable than current molecular platforms but also more suitable for use at lower tiers of the health system [1-3]. If these products enter the market with the anticipated features and price points, they could represent a paradigm shift by offering the potential to provide direct, short-distance access to TB testing at a scale that was previously out of reach, considering traditional, molecular TB diagnostic platforms.
This high-level, multi-country analysis offers a first approximation of what it might actually take to bring TB testing within short, walk-in distance for the majority of people.
Introduction
Access to health care
Access to diagnostics (like any health service) is determined by five key pillars: affordability, availability, knowledge, acceptability, and geographic accessibility [4,5]. All five dimensions influence whether patients seek care and whether they receive it. This analysis focuses specifically on geographic accessibility, i.e., the physical proximity of TB diagnostic services to the people who need them.
It is well established in public health that the likelihood of seeking care declines as the distance to health services increases [6,7]. As a result, Ministries of Health around the world aim to bring essential services closer to where people live. A common benchmark for general primary health care (PHC) is a maximum travel distance of 5 kilometers to the nearest facility, a target that has been adopted in national health strategies across multiple countries, including Malawi, Uganda and Kenya [8-10].
The limitations of current molecular diagnostic platforms
Ideally, TB diagnosis would follow the same model: direct, walk-in access at local health facilities, much like what exists for primary health care. However, current market prices for molecular diagnostic instruments (often at least USD 10,000 per unit [11]) and laboratory infrastructure requirements have made it prohibitively expensive and technically unfeasible to equip enough sites to achieve walk-in access. As a result, only a small proportion of health facilities are equipped with rapid molecular tests [12], and most countries instead rely on specimen referral systems to bridge the accessibility gap.
However, these referral networks, while essential, come with limitations: they are logistically complex, expensive to maintain, and prone to delays or service interruptions. For many patients, this indirect route to diagnosis still means long waits, multiple visits, and delayed treatment initiation.
A future vision: TB diagnostics within walk-in distance?
The emergence of new TB diagnostics that are potentially far more affordable and decentralizable [1-3] could be a game changer as they could be deployed at a much larger scale than current technologies. This in turn, could offer the potential for direct, short-distance access to TB testing at a scale that was previously out of reach, considering traditional, molecular TB diagnostic platforms.
But is this vision of TB diagnostics within typical PHC distance (approx. 5km) realistic? How many health facilities would actually need to be equipped to bring TB testing within short, walk-in distance for most people? This high-level, multi-country analysis offers a first approximation of what it might actually take.
About this analysis
To explore this, a two-part geographic accessibility analysis was conducted across 11 countries in East and Southern Africa using publicly available data.
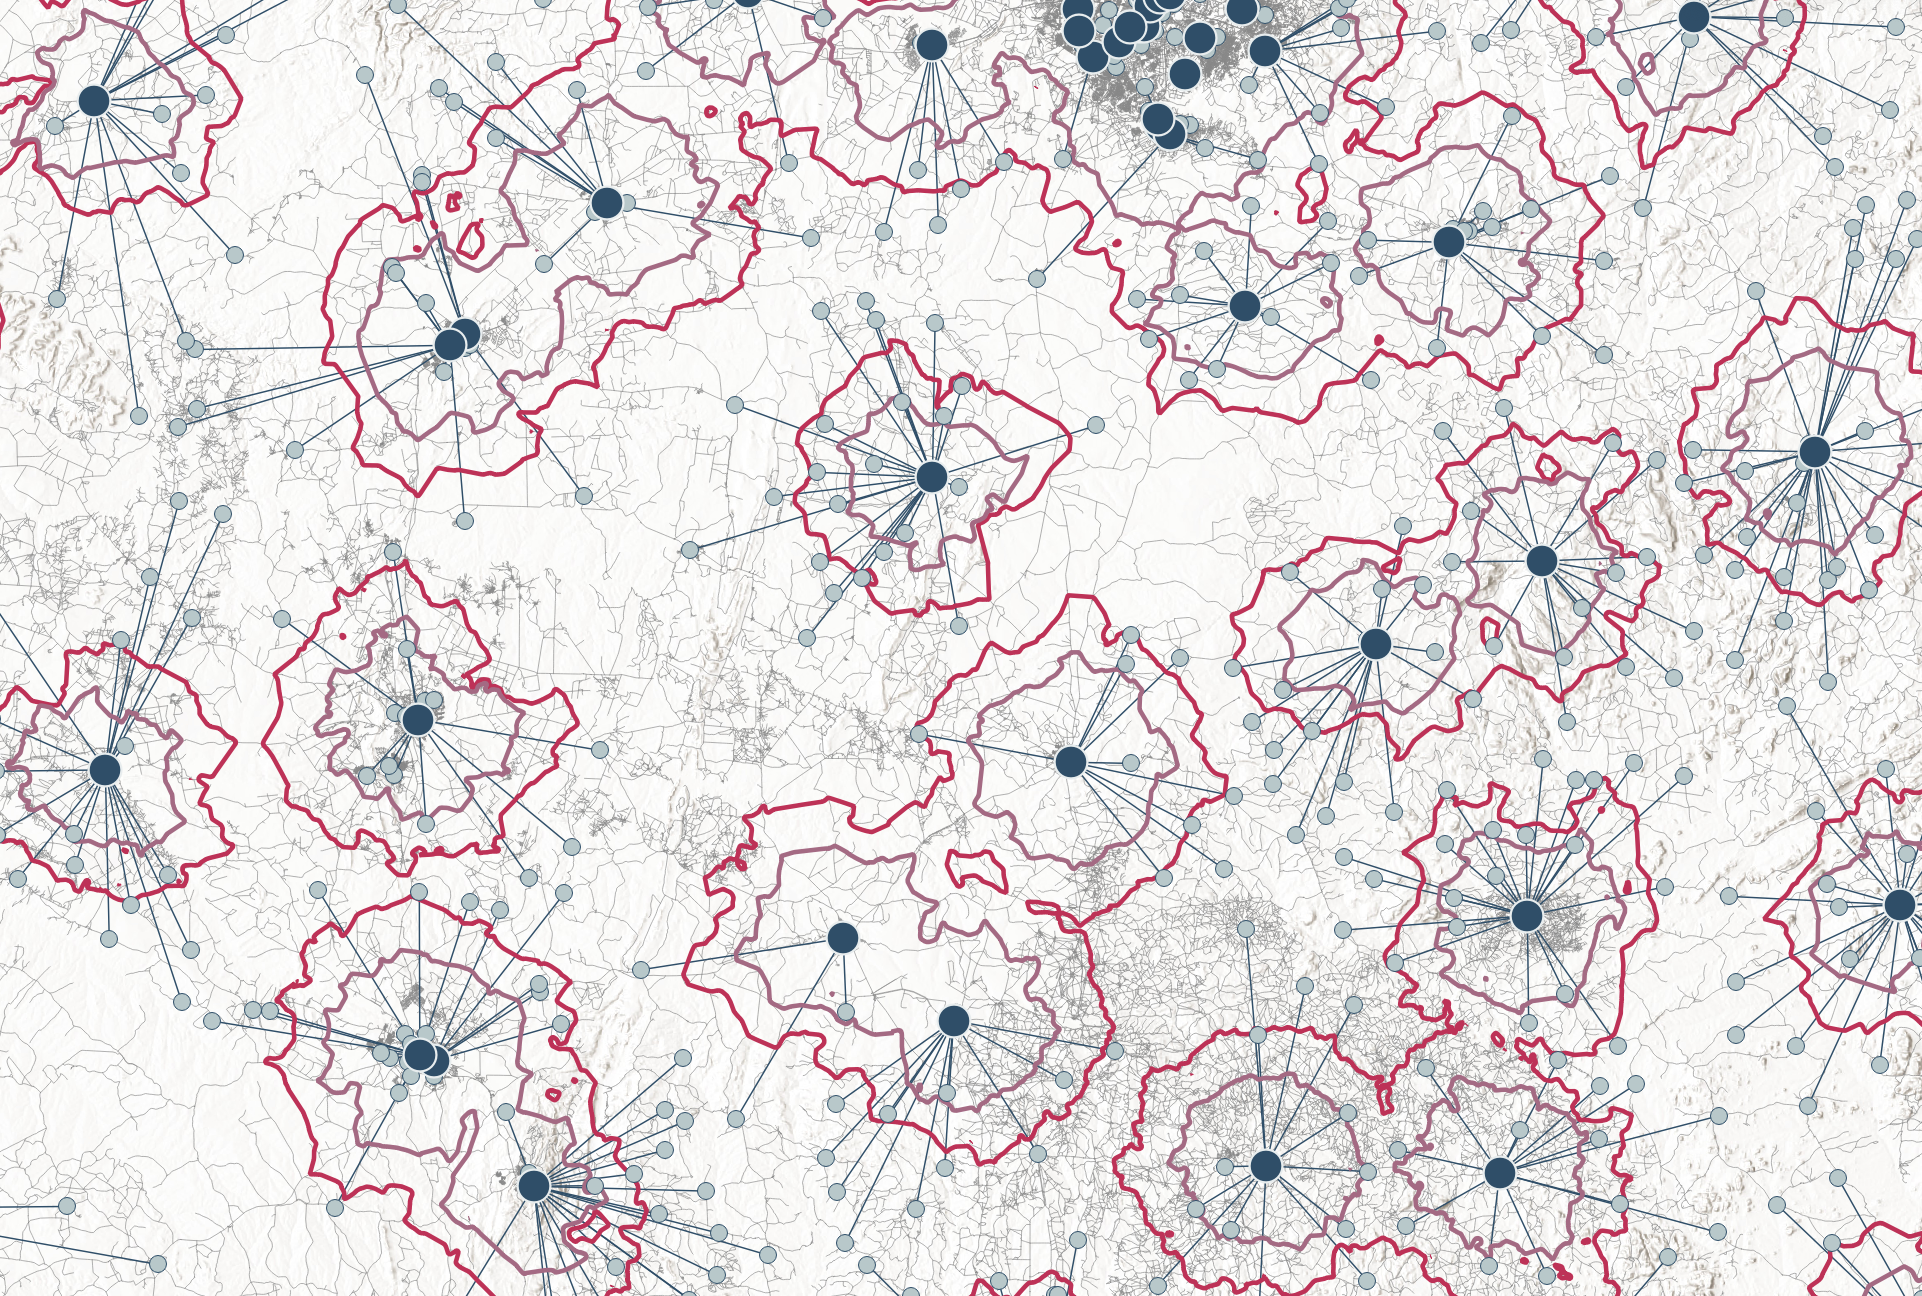
Briefly, the analysis first estimated the percentage of the population with access to a health facility in the public (P) or private not-for-profit (PNFP) sector in 5km (Euclidean distance), resembling PHC-distance. This is the maximum share of the population that can be reached through existing facility-based services in 5km. Understanding this upper limit is essential when planning the distribution of new diagnostics, as it helps determine whether facility-based placement alone is sufficient, or whether complementary service delivery models may be needed to achieve truly accessible testing.
Second, the analysis modeled how many health facilities would need to be equipped with TB diagnostics to ensure that the majority of of this “reachable population” would have access to a diagnostic site within 5 km of where they live. Geospatial optimization techniques were used to select the most effective facility locations for maximizing coverage.
Key results
How many people can reach a health facility in walk-in distance: understanding the baseline
The geospatial analysis revealed considerable variation across countries in the proportion of the population that can realistically access public or PNFP-sector health facilities within a 5km radius. In South Africa, approximately 90% of the total population lives within this distance – forming a large reachable population. In contrast, in Mozambique, the reachable population includes only about half of the national population [Figure 1].
These differences often reflect a mix of structural factors, such as difficult terrain, as in mountainous Lesotho, or widely dispersed populations, as seen in Namibia or parts of Mozambique. In some countries, like Malawi, governments have already recognized the challenges and are actively working to expand their health facility networks to improve geographic accessibility [8].
But regardless of underlying reasons, these differences points to the important first consideration for the placement of new TB diagnostics: If the aim is to provide access to TB diagnostics within short distances such as 5km, then facility-based approaches alone may not be sufficient in all settings. In countries where large segments of the population live beyond 5 km of existing facilities, alternative strategies may be needed: These could include expanding the facility network, adopting mobile or community-based delivery models, or adjusting service distance targets to reflect geographic realities [Table 1].
Figure 1: Proportion of people who can reach a health facility in 5km distance. Health facilities include only P/PNFP sector facilities. The circle size corresponds to the total number of facilities. This figure is interactive. [View tabular data]
TB testing within walk-in distance: how many facilities are needed?
To explore this question, a series of geospatial modelling scenarios were developed to reflect different scale-up strategies. Each scenario assumed that an increasing number of P/PNFP health facilities would be equipped with new TB diagnostics, ranging from a limited roll-out to full national deployment at all health facilities. For each strategy, it was estimated how much of the population could be reached within a 5 km radius of the selected facilities.
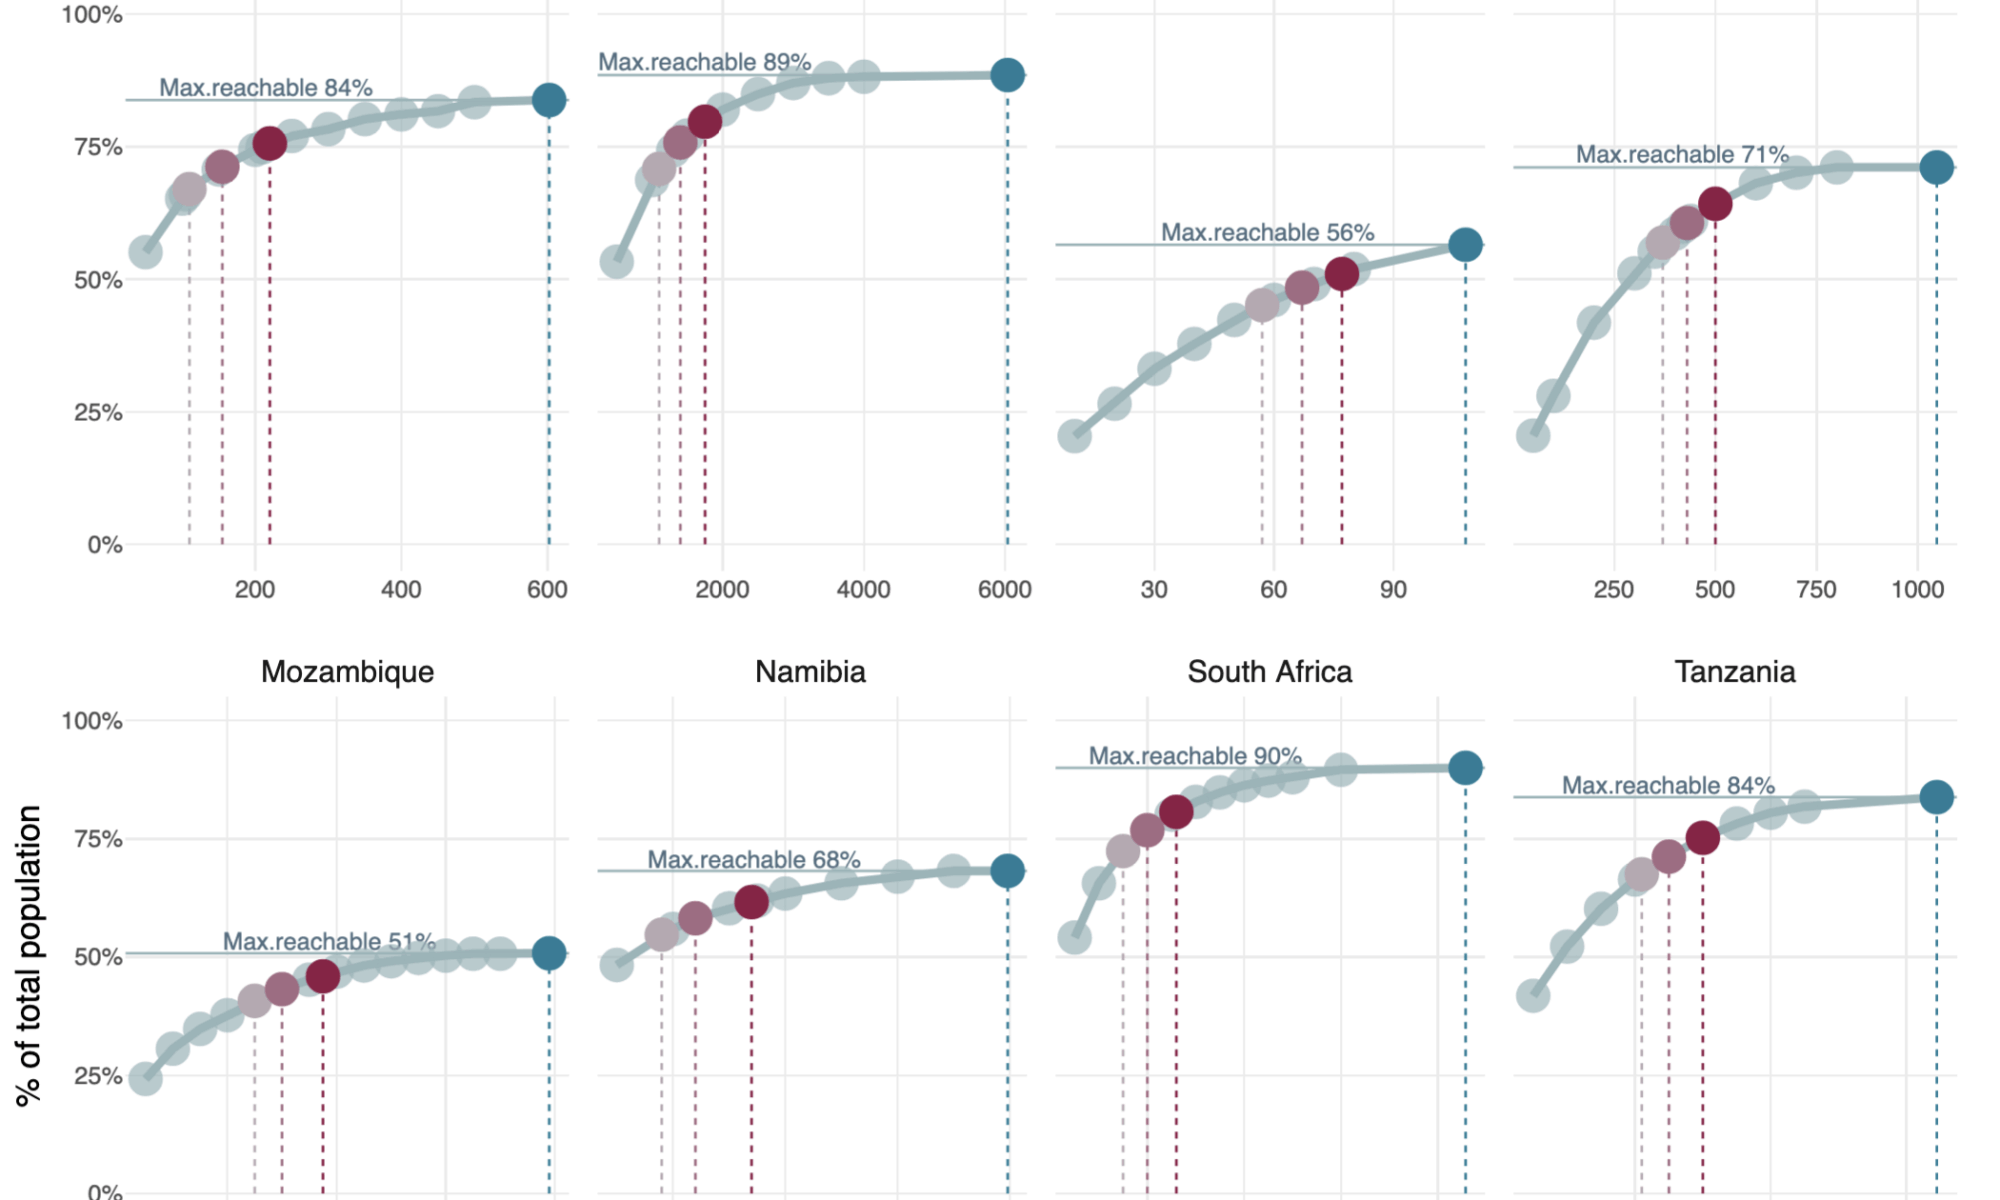
The modelling results show a consistent pattern across all countries [Figure 2]: population coverage increases rapidly when the first set of facilities is equipped, but the gains taper off as more sites are added. This effect of diminishing marginal returns reflects the reality that early-equipped facilities tend to be placed at the largest population clusters, while later additions often cover smaller or more dispersed communities. In countries with less concentrated populations or sparse facility networks (like e.g. Lesotho, Mozambique or Zimbabwe), the gains are slower, the curves remain flatter and even full deployment may still leave geographic gaps.
Take Kenya as a more concrete example: the country has 6,036 public and PNFP facilities, which together provide geographic access to 89% of the total population. As outlined earlier, this represents the maximum population that can be reached through facility-based services within 5 km. However, to provide broad geographic access to TB diagnostics, it is not necessary to equip every facility. Equipping just 1,750 sites (around 29% of the total) would be sufficient to ensure that 90% of the reachable population could access a diagnostic facility within 5 km. If the target were set lower, such as 80%, only 1,100 facilities (18%) would need to be equipped [Figure 2].
These patterns highlight the second key insight from the analysis: high levels of geographic coverage in the analyzed countries can be achieved without equipping every facility – provided that facility-based placements are guided by geospatial optimization, as demonstrated in this analysis.
Figure 2: TB testing within walk-in distance: how many facilities are needed?
Max. reachable %” depicts the maximum % of the total population that can reach any P/PNFP facility within 5km (as in Fig.1). Reachable population refers to the people who live within 5 km of any P/PNFP health facility. Red circles highlight the number of facilities needed to cover 80%, 85% and 90% of the maximum reachable population. This figure is interactive. [View tabular data.]
A similar pattern holds across all countries analyzed: to cover a large share of the reachable population, only a targeted subset of facilities must be equipped: to cover 80% of the reachable population, countries could do so by equipping between 17.5% and 52.8% of their national facility network; in eight out of eleven countries, this means fewer than 1,000 facilities need to be equipped. When aiming for 90% coverage, however, still six out of eleven countries would require fewer than 1,000 facilities to meet that target [Table 2, Figure 2].
These observations point to the third key insight: while the number of facilities required for broad accessibility is modest and very feasible in some countries, it remains sizable in others – yet, for most, is not completely out of reach anymore. If future TB diagnostics are priced in the range of a few hundred USD, compared to the USD 10,000–18,000 often required for current molecular platforms [11], then the total cost of large-scale deployment could become far more manageable. While this analysis does not include detailed costing of lab start-up or operational expenses, it illustrates how substantially cheaper device prices may enable a level of geographic accessibility that has so far been out of reach.
Implications for a way forward
This high-level, multi-country analysis provides a first approximation of what it might take to bring TB testing within short, walk-in distance for most people. The findings offer three key insights with concrete implications for future planning, funding, and implementation.
(1) It is not necessary to equip every health facility to achieve high levels of geographic accessibility – but placement must be guided by geospatial optimization.
- Even relatively simple and rapid geospatial techniques can help countries identify a targeted subset of facilities that, when equipped, would ensure broad access within desired distances for most people. This has important implications for future planning: it allows programs to avoid costly over-supply, focus resources where they matter most, and develop more practical, cost-effective diagnostic strategies. Streamlined spatial analyses can be integrated early in the planning process to strengthen budgeting, funding proposals, and the design of more detailed implementation plans.
(2) The number of facilities needed is actually modest in most countries. It remains sizable in others – but annualized platform costs are key.
- The number of facilities that would need to be equipped with TB diagnostics varies considerably across countries. In most, only a modest number of facilities is sufficient to ensure broad geographic access; in others, the required numbers are more sizable. However, even these larger figures could become feasible – but only if platform procurement costs, and critically, the total annualized cost (i.e. procurement costs amortized over the instrument’s lifetime, plus service, maintenance and repair), remain exceptionally low. Future diagnostic platforms priced in the range of a few hundred USD, with durable performance and minimal service needs, could make levels of geographic accessibility attainable that were previously out of reach.
- Importantly, affordability also depends on test pricing, other start-up costs, and the ability to sustain routine operations over time. Rapid, high-level costing exercises – even if approximate – are essential to assess the true viability of large-scale deployment. Early costing can strengthen the evidence base, guide smarter investment decisions, and help ensure that expansion plans are financially sustainable from the outset.
- Streamlined geospatial analysis combined with costing analyses, could contribute to early market size estimations, in turn, support pooled procurement strategies and more effective manufacturer engagement. By contributing early evidence, analyses like this can help donors, TB programs, and advocates strengthen price negotiations, avoid high(er) market entry pricing, and ideally reduce the future need for buy-down agreements [14].
(3) In some settings, facility-based models alone may not be enough and complementary service delivery strategies might be needed.
- While many people can be reached through existing health facilities, this is not the case everywhere. In several countries, particularly those with sparse facility networks or dispersed populations, large parts of the population live beyond 5 km from the nearest health facility. In such settings, relying solely on facility-based models may not be sufficient to achieve meaningful access to TB diagnostics.
- Planning in these contexts must therefore begin with a realistic assessment of whether longer distances genuinely pose a barrier to care, including an assessment whether existing specimen referral systems are a timely, reliable, and affordable alternative. Where gaps persist, countries may need to consider complementary approaches such as mobile units, community-based models, or expanding the facility network. There is no one-size-fits-all solution, but blending strategies from the beginning – rather than layering them in as afterthoughts – may offer an economically more efficient path to equitable access.
Methods
Data sources
Where available, the official master health facility list from Ministries of Health were used for Botswana [15], Namibia [16], Malawi [17], Zambia [18]. For Kenya, Lesotho, Mozambique, South Africa, Tanzania and Zimbabwe, master lists of health facilities were extracted from Maina et al. 2019 [19].
Population data used the constrained individual countries 2020 UN-adjusted (100m) data from Worldpop.org [20].
Administrative boundaries were downloaded from geoBoundaries [21].
Data preparation
- The master lists of health facilities from Maina et al. [19] were used without any further modifications; these include public and PNFP facilities only. For Botswana, Namibia, Malawi and Zambia, public and PNFP facilities were extracted from the originals [15-18]. Further cleaning involved the removal of facilities labelled as non-operational as well as non-relevant services (such as dentists, eye clinics) and the removal of facilities with GPS coordinates outside country boundaries; no further coordinate validation was done.
Geospatial methods
Using QGIS 3.34.7, Voronoi polygons were created around each health facility to represent theoretical service areas. The total population within each polygon was determined and attributed to its respective health facility point location using the zonal-statistics- and the join-attributes-by-field-value tools.
Optimal locations for varying numbers of diagnostic facilities were identified using ArcGIS’s Location-Allocation (Maximum Coverage) algorithm at 5500m cutoff distance. To enable Euclidean distance based optimization, an artificial road network was created for each country using a triangulated grid of lines.
Final population coverage was estimated by generating a 5km buffer around the selected facility locations and summing the population within these polygons using the zonal statistics tool, whereby the total population in admin0 was used as denominator.
Analysis & DataViz
- Data analysis and visualization were conducted using RStudio (version 2024.09.0+375). Key packages were tidyverse, ggplot2, plotly, DT, and scales packages.
Limitations
Facility data may include inaccuracies. While only credible sources were used (e.g. Ministry of Health lists and Maina et al. [15-19]), no additional validation or correction was applied. This may lead to over- or underestimation of accessibility and facility needs, if the data are inaccurate. Data retrieved from Maina et al. [19] were published in 2019, and some countries might have expanded the facility network since, which could have led to an underestimation of accessibility and overestimation of facility needs. For Malawi, numerous facilities were attributed to identical coordinate batches. These were kept in the total facility count but, by the way of analysis, do not contribute to facility coverage correctly. This might lead to an underestimation of population coverage in Malawi. An updated analysis is recommended.
Private-for-profit (PFP) facilities were not included. In countries where PFP sites contribute significantly to service delivery, their exclusion may underestimate baseline accessibility. In three countries where PFP facility data were available (Zambia, Namibia and Malawi), the population coverage differed by less than 1% point (data not shown). Moturi et al. [13] also found little difference in travel time between public- and public+private health facilities in Kenya. However, for programmatic implementation planning, a more detailed analysis should be done for countries with a large PFP-sector.
Straight-line distance ≠ road network distance ≠ travel time. This analysis used Euclidean distance, which typically corresponds to 6–7 km on road networks in the countries analyzed; 5km walking on a relatively flat surface corresponds to approx. 1hr walking time. While straight-line modelling provides a simple and practical estimate of geographic accessibility, more advanced approaches, including travel time analysis and network-based modelling, could further refine accessibility estimates in future work.
Only geographic accessibility was assessed. Programmatic feasibility also depends on start-up, operational, and test costs – which were not analyzed here. A detailed costing or cost-efficiency analysis would be needed to assess the viability of large-scale deployment. More broadly, readers are reminded again that distance alone does not solely define access as access also depends on availability of quality services, affordability, knowledge, and acceptability [4,5]; barriers related to these dimensions should also be considered during programmatic planning for new test introduction.
Given these limitations, the results presented here should be seen as a high-level approximation to inform early strategic discussions. For more refined national planning or programmatic implementation, countries would need updated facility data, more detailed accessibility modelling (e.g., travel time), and full consideration of operational and cost factors. This analysis aims to provide a starting point, not a substitute, for the more granular work that would be required to design and implement national diagnostic strategies.
References
[1] FIND DxConnect Test Directory. 2025
[2] Treatment Action Group 2024. Tuberculosis Diagnostics Pipeline Report 2024.
[3] Altruan. Pluslife MiniDock PCR. Product page. Accessed 24 April 2024.
[4] D. Peters, A. Garg, G. Bloom, D. Walker and W. R. M. Brieger, “Poverty and access to health care in developing countries,” Ann N Y Acad Sci, vol. 1136, pp. 161-71, 2008. doi 10.1196/annals.1425.011
[5] B. Jacobs, P. Ir, M. Bigdeli, P. Annear and W. Van Damme, “Addressing access barriers to health services: an analytical framework for selecting appropriate interventions in low-income Asian countries,” Health Policy Plan. 2012. doi 10.1093/heapol/czr038
[6] R. Stock, “Distance and the utilization of health facilities in rural Nigeria”, Social Science & Medicine. 1983. doi 10.1016/0277-9536(83)90298-8
[7] Noor AM, Zurovac D, Hay SI, Ochola SA, Snow RW. Defining equity in physical access to clinical services using geographical information systems as part of malaria planning and monitoring in Kenya. Trop Med Int Health. 2003 doi 10.1046/j.1365-3156.2003.01112.x
[8] Government of the Republic of Malawi. Health Sector Strategic Plan III. 2023-2030
[9] Republic of Uganda, Ministry of Health. Guidelines for Designation, Establishment and Upgrading of Health Units. 2011.
[10] Gavi. Stories from the community. How Kenya is bringing primary care closer to the community, 2024
[11] StopTBP GDF. Diagnostics, Medical Devices & Other Health Products Catalog. 2024
[12] WHO-Global Programme on Tuberculosis & Lung Health. Global tuberculosis report 2024. Laboratory Diagnostic Services Data Set.
[13] Moturi AK, Suiyanka L, Mumo E, Snow RW, Okiro EA, Macharia PM. Geographic accessibility to public and private health facilities in Kenya in 2021: An updated geocoded inventory and spatial analysis. Front Public Health. 2022 doi 10.3389/fpubh.2022.1002975
[14] David Branigan, Treatment Action Group. 2020. Advancing Access through Market Interventions: Lessons Learned from the GeneXpert TB Test Buy-down
[15] Ministry of Health Botswana. Health Facility List. Download date: 11 April 2025.
[16] Ministry of Health and Social Services Namibia. Master Facility List. Download date: 04 April 2024.
[17] Ministry of Health Malawi. MasterHealth Facility Registry. Download date: 11 April 2025.
[18] Ministry of Health Zambia, Zambia Statistics Agency (ZamStats). Master Facility List. Download date: 11 April 2025.
[19] Maina, J., Ouma, P.O., Macharia, P.M. et al. A spatial database of health facilities managed by the public health sector in sub Saharan Africa. Sci Data 6, 134, 2019. doi 10.1038/s41597-019-0142-2
[20] Bondarenko M., Kerr D., Sorichetta A., and Tatem, A.J. 2020. Census/projection-disaggregated gridded population datasets, adjusted to match the corresponding UNPD 2020 estimates, for 51 countries across sub-Saharan Africa using building footprints. WorldPop, University of Southampton, UK. WorldPop Hub
[21] GeoBoundaries
Appendix tables
Table 1: Maximum population that can be reached through facility-based services in 5km, 10km and 15km
[View plotted data.]
Table 2: TB testing within walk-in distance: how many facilities are needed?
Definitions: % of total population covered = the proportion of the entire national population (not just reachable) covered if selected facilities in the sectarian were equipped with a TB diagnostic platform. % of reachable population covered = the proportion of the reachable population (i.e. those who live within 5 km of any health facility) that would have access to a diagnostic site in that scenario. Threshold = marks rows where population coverage meets or exceeds illustrative thresholds (80%, 85%, or 90% of the reachable population). To see for example the total number of facilities needed to be equipped to reach for example 85% of the reachable population across all countries, filter on “85” in the column “Threshold”. [View plotted data.]
Author notes: This analysis was conducted independently and without external funding. There are no conflicts of interest to declare. It was developed as a personal contribution to advance practical thinking around diagnostic access — especially at a time when global health efforts face growing uncertainty. While modest in scope, it is shared in the spirit of encouraging others for continued contributions, even outside large platforms or institutional support.
While this work was developed without institutional funding, it was not without support. Some sections were drafted and refined with the help of OpenAI’s ChatGPT, a language model that proved especially useful for translating geospatial modelling jargon into human-readable English. All analytical decisions and conclusions are entirely my own.
Disclaimer: While every effort was made to ensure the accuracy and transparency of this analysis, the results are based on publicly available data and simplified modelling assumptions. They are intended to inform high-level discussions and should not be interpreted as definitive guidance for programmatic decision-making. Users are encouraged to critically assess the relevance and limitations of these findings in their own context before applying them.
CC BY-NC 4.0: This work is available under a Creative Commons Attribution-NonCommercial 4.0 International License. You are free to share, use and adapt the material for any non-commercial purpose, provided the original source is referenced.
Suggested citation: Rehr, M. (2025). How far is TB testing? A high-level, multi-country analysis of what it might take to bring TB diagnosis within walk-in distance. NOSOMICS. [https://nosomics.org/how-far-is-tb-testing-spatial-access/]